6.4 Quartiles, outliers, and distribution shape
Ordered summaries show how data are distributed and provide measures that remain useful when observations are skewed or include extremes.
6.4.1 Five-number summaries and boxplots
Interquartile range. The spread of the middle half of the data, \(IQR=Q_3-Q_1\).
The five-number summary is minimum, \(Q_1\), median, \(Q_3\), maximum. A boxplot displays these values. Potential outliers lie below \(Q_1-1.5IQR\) or above \(Q_3+1.5IQR\). A flagged point should be investigated, not automatically deleted.
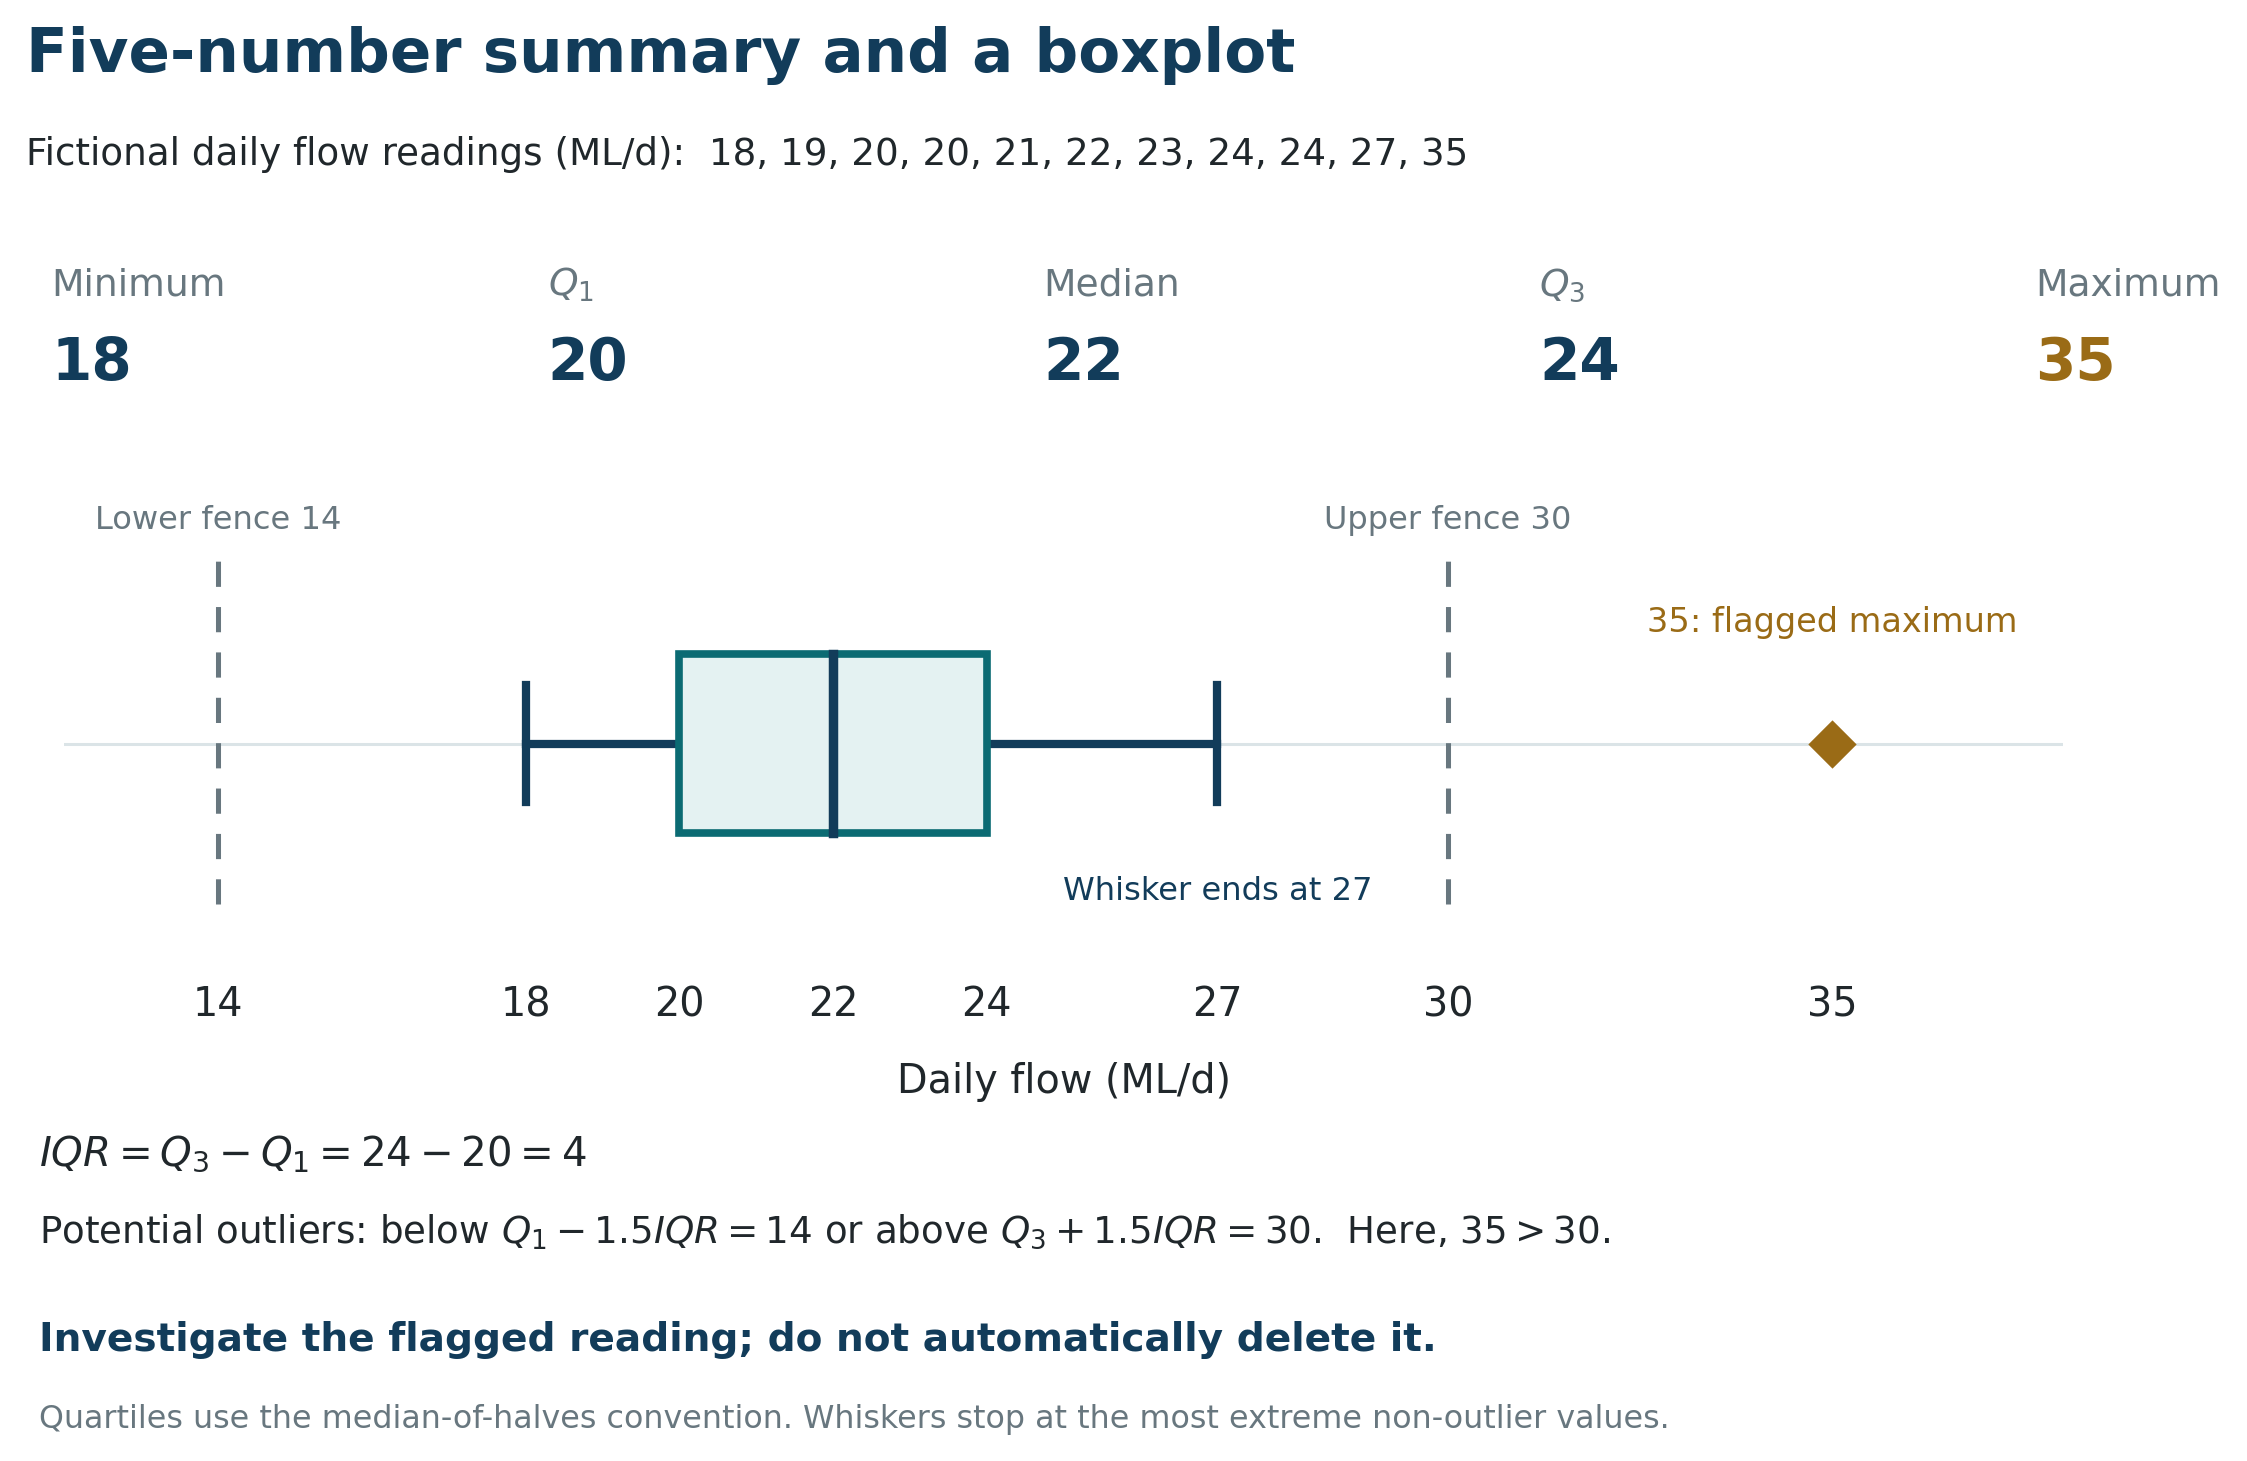
Worked Example: Finding outlier fences
If \(Q_1=12\) and \(Q_3=20\), then \(IQR=8\). The fences are \(12-12=0\) and \(20+12=32\). Values below 0 or above 32 are potential outliers.
Check Your Work
\(IQR=6\); fences are \(-5\) and 19.Worked Example: Constructing a five-number summary
For \(2,4,5,7,9,12,15\), the median is 7, \(Q_1=4\), and \(Q_3=12\). The five-number summary is \((2,4,7,12,15)\).
Check Your Work
Using medians of the halves excluding the overall median: \((1,2,4,7,8)\).6.4.2 Skewness and choosing summaries
Skewed distribution. A distribution with a longer tail on one side than the other.
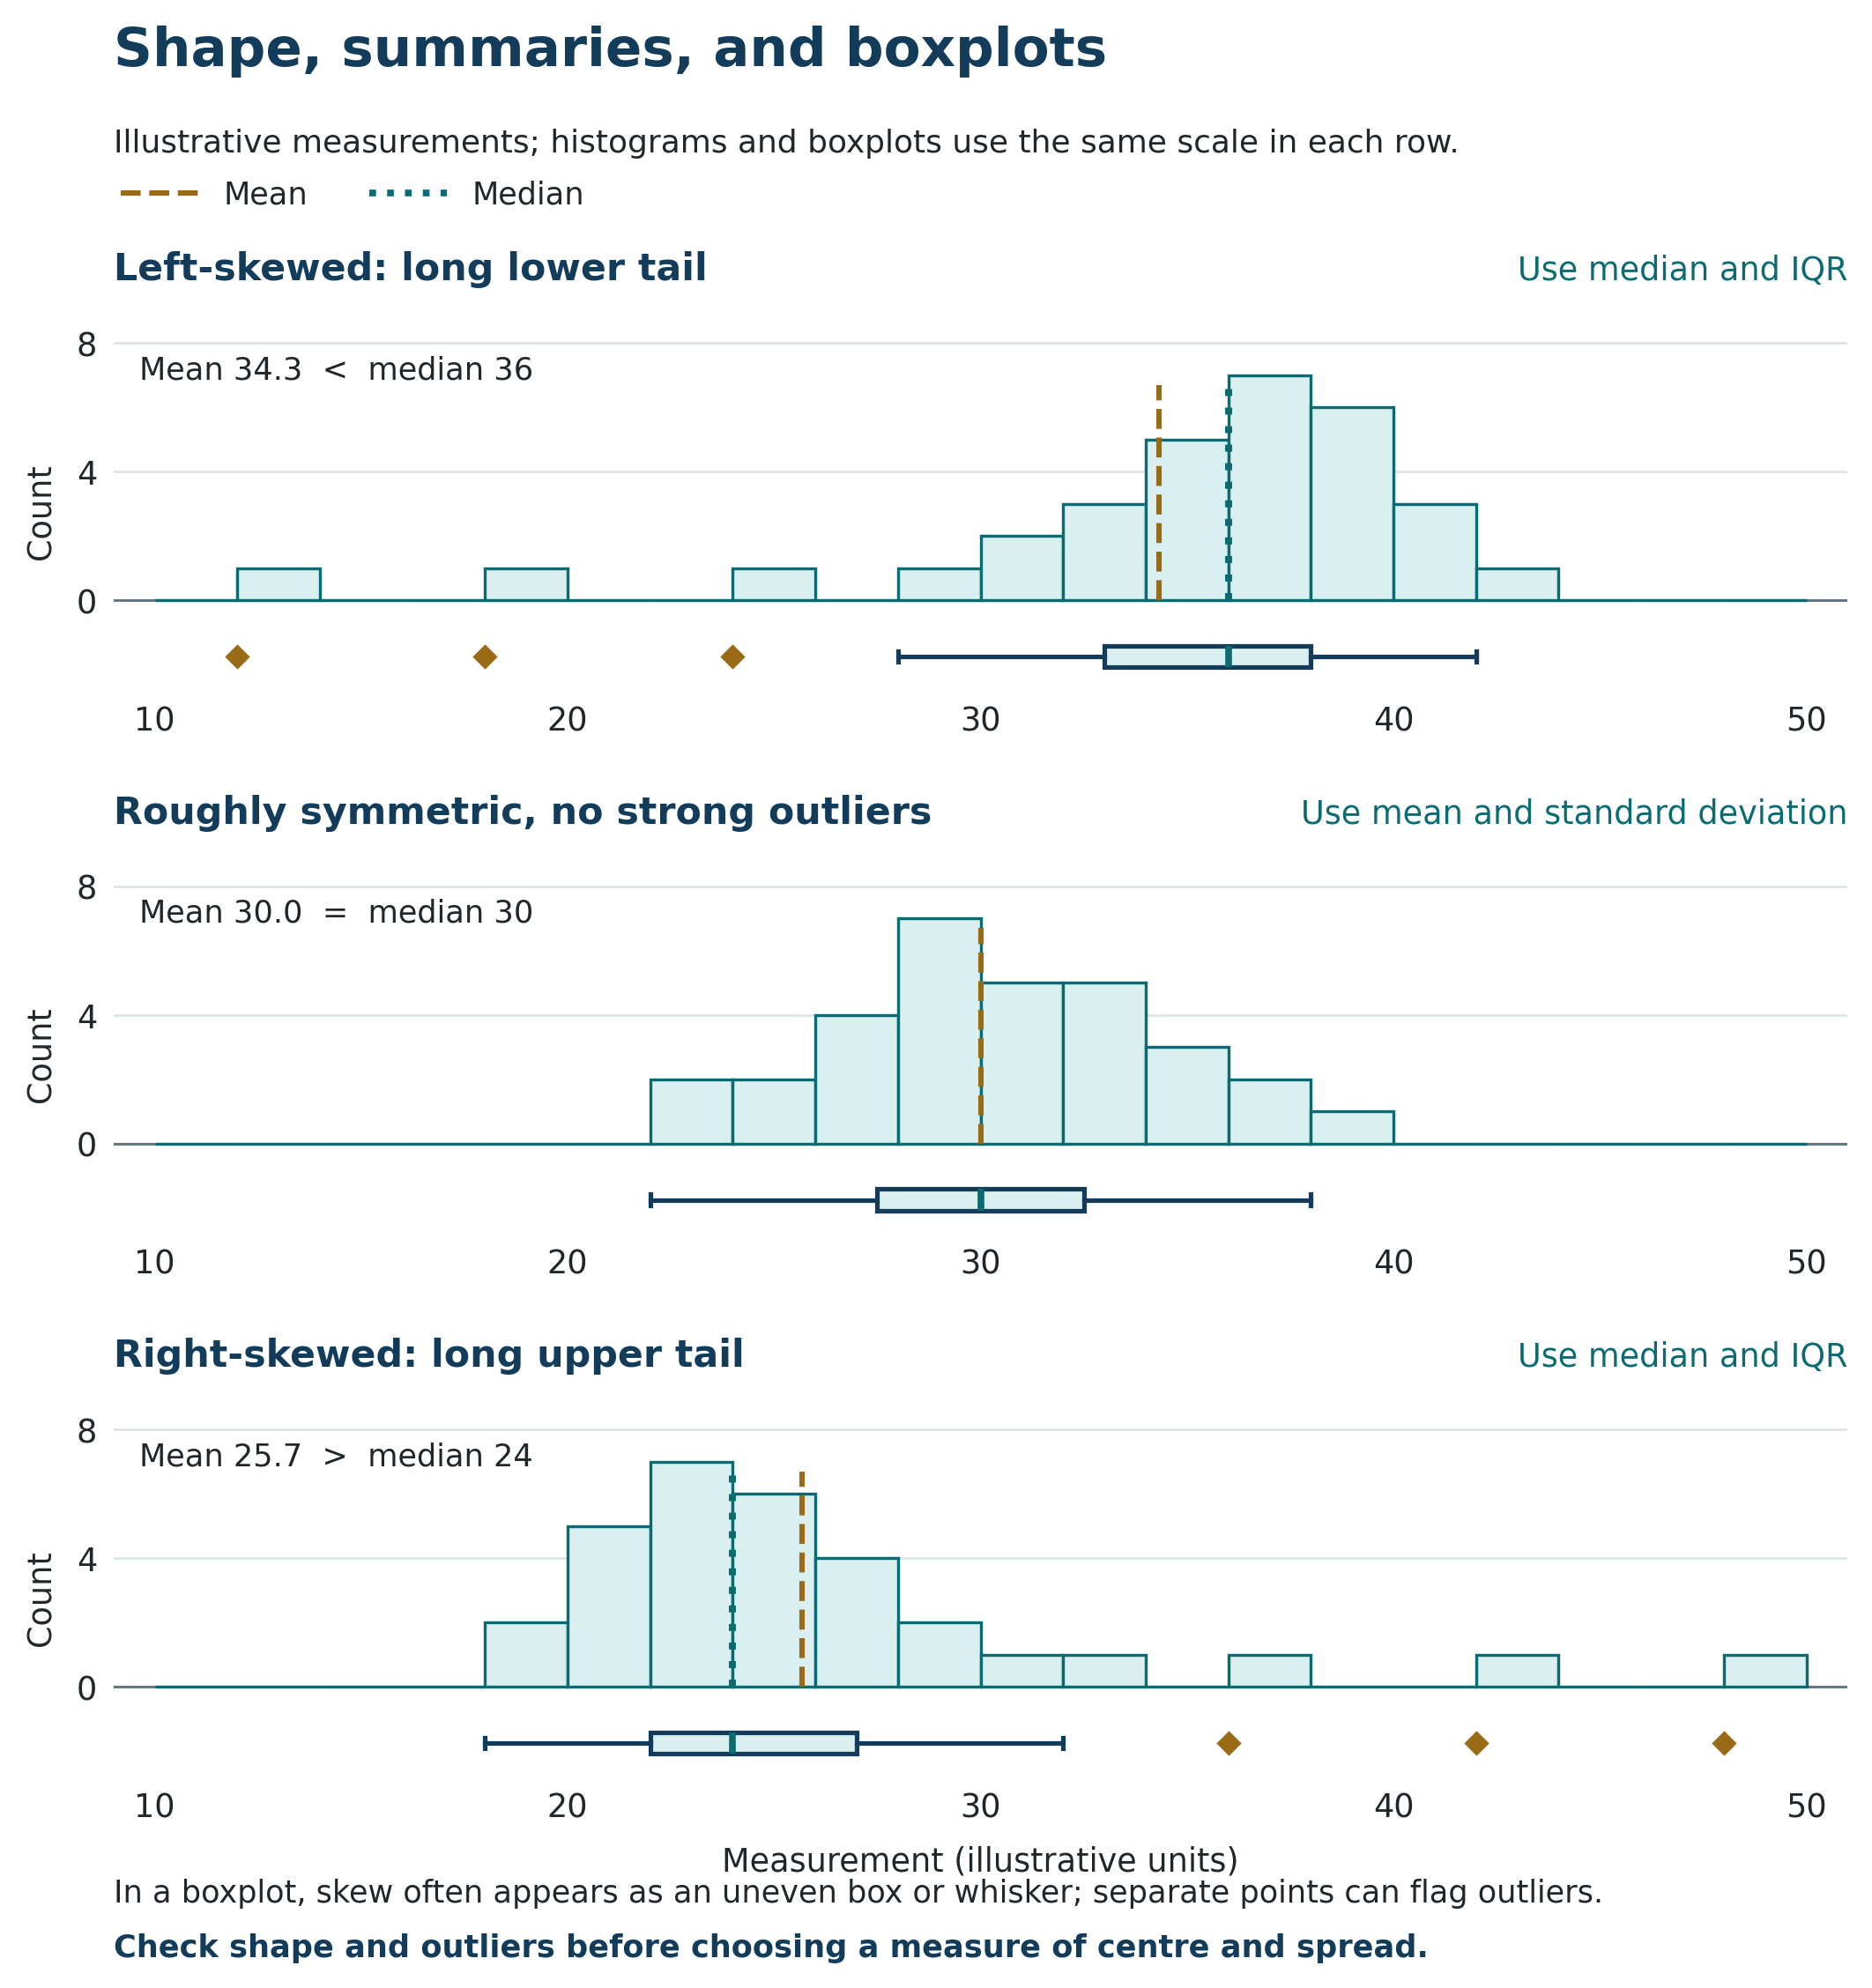
Right-skewed distributions usually have mean greater than median; left-skewed distributions usually have mean less than median. For roughly symmetric data without strong outliers, use mean and standard deviation. For skewed data or data with outliers, use median and IQR.
Worked Example: Choosing resistant summaries
Most repair times are under 4 h, but one major failure requires 38 h. The distribution is right-skewed, so median and IQR better describe a typical repair time and spread.
Check Your Work
Mean and standard deviation.Worked Example: Predicting the effect of an extreme value
Increasing the largest observation from 64,401 to 150,000 raises the mean and standard deviation substantially. The median and IQR may remain unchanged because the ordered middle positions do not move.
Check Your Work
It generally increases, often noticeably.One Possible Answer
The value 52 creates a long right tail, so the distribution is right-skewed. Median and IQR are preferable. The value 52 raises the mean and standard deviation much more than it affects the median and IQR and should be investigated as a possible unusual operating event.6.4.3 Practice Problems
- Name the five values in a five-number summary.
Check Your Work
Minimum, \(Q_1\), median, \(Q_3\), maximum. - Find the IQR if \(Q_1=14\) and \(Q_3=29\).
Check Your Work
15. - Find the upper fence for \(Q_1=10\), \(Q_3=18\).
Check Your Work
\(IQR=8\), so upper fence \(=30\). - Which is more resistant, mean or median?
Check Your Work
Median. - For right skew, which is usually larger, mean or median?
Check Your Work
Mean. - Pressure data contain one sensor error of 900 kPa among values near 400 kPa. Which summaries should be reported initially?
Check Your Work
Median and IQR, with the extreme value investigated. - Flow quartiles are 12 and 28 L/s. Find IQR and outlier fences.
Check Your Work
\(IQR=16\); the fences are \(-12\) L/s and 52 L/s. - Repair times have a long right tail. Choose centre and spread.
Check Your Work
Median and IQR.