4.5 Change of base, logarithmic scales, and flow duration
Logarithmic scales compress large ranges by representing equal ratios with equal distances. They make multiplicative patterns and power relationships easier to see.
4.5.1 Change of base and orders of magnitude
Change-of-Base Formula. For valid bases \(a\) and \(b\),
\[\log_bx=\frac{\log_ax}{\log_ab}.\]
The number of orders of magnitude separating positive values \(A\) and \(B\) is \(\log_{10}(A/B)\). One order represents a factor of 10.
Worked Example: Changing logarithm base
\[\log_7(20)=\frac{\ln20}{\ln7}\approx1.5395.\]
Check Your Work
\(\ln14/\ln3\approx2.402\).Worked Example: Comparing concentration scales
Concentrations \(10^5\) cells/mL and \(10^2\) cells/mL differ by
\[\log_{10}(10^5/10^2)=3\]
orders of magnitude.
Check Your Work
\(\log_{10}(10^4)=4\) orders.4.5.2 Semi-log, log-log, and flow-duration graphs
Semi-log graph. A graph with one logarithmic axis and one linear axis.
Log-log graph. A graph with logarithmic scales on both axes.
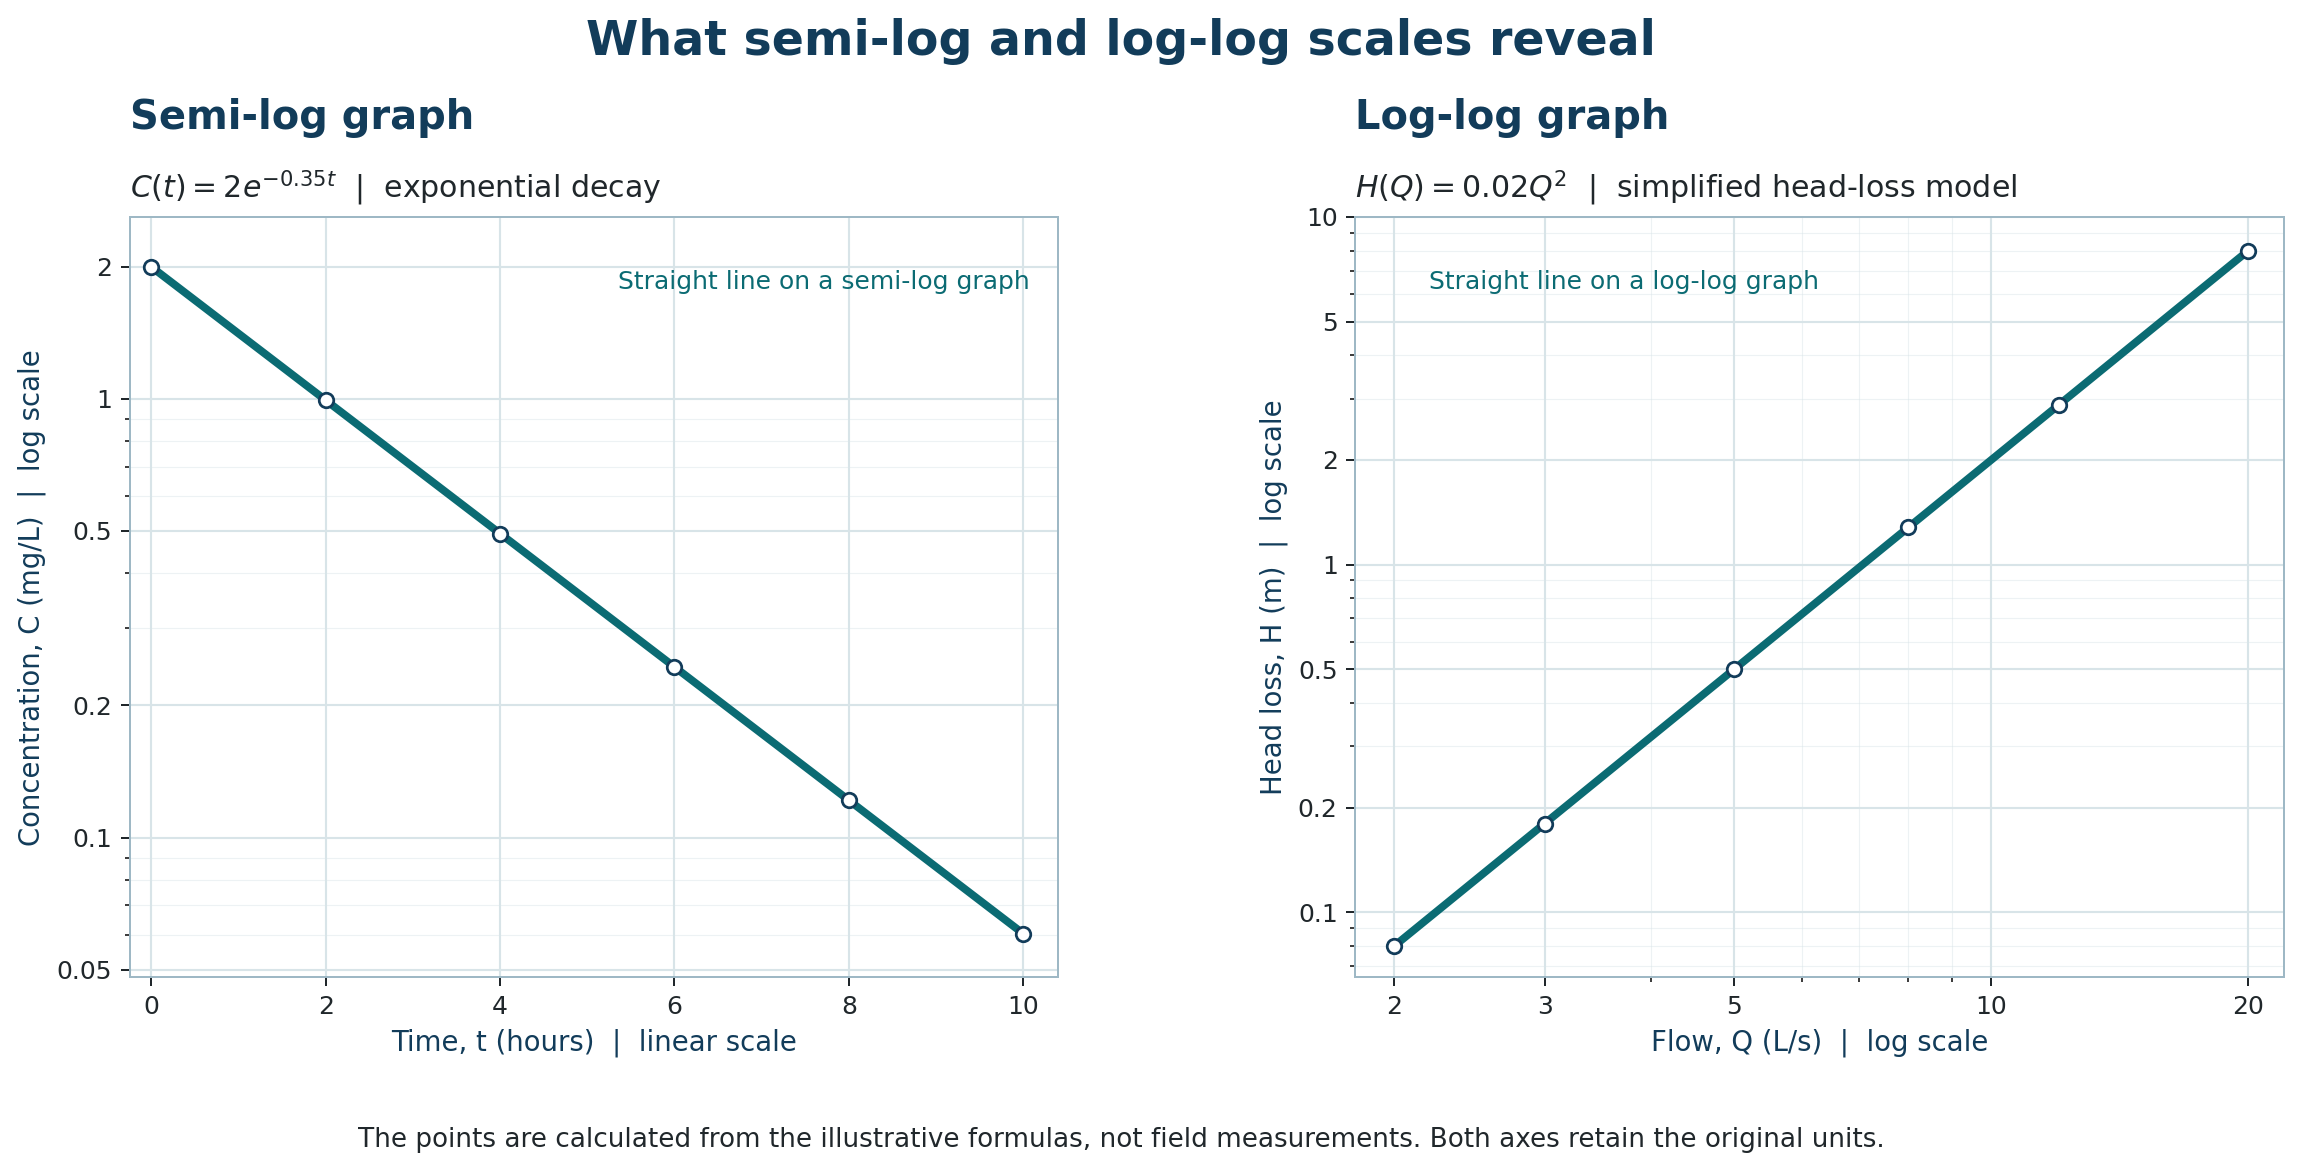
Exponential data become approximately linear when the response is logged and plotted against a linear input. Power-law data become linear when both variables are logged. A flow-duration curve plots discharge against the percentage of time that flow is equalled or exceeded. It helps characterize dependable flow and compare discharge magnitudes across a wide range.
Worked Example: Reading a flow-duration point
If a flow-duration curve shows 18 m³/s at 80% exceedance, then streamflow equals or exceeds 18 m³/s approximately 80% of the observation period.
Check Your Work
Flow equals or exceeds 35 m³/s about 20% of the time.Worked Example: Linearizing exponential decay
If \(C(t)=C_0e^{-kt}\), then
\[\ln C=\ln C_0-kt.\]
A plot of \(\ln C\) against \(t\) is linear with slope \(-k\) and intercept \(\ln C_0\).
Check Your Work
\(\ln N=\ln80+0.3t\).Applied Problem: Interpreting dependable streamflow. A flow-duration table reports 42, 25, and 11 m³/s at exceedance percentages 10%, 50%, and 90%. Interpret all three values and identify the median daily flow.
Check Your Work
Flow equals or exceeds 42 m³/s about 10% of the time, 25 m³/s about 50% of the time, and 11 m³/s about 90% of the time. The 50% exceedance value is the median daily flow, 25 m³/s.4.5.3 Practice Problems
- Evaluate \(\log_4(11)\) using change of base.
Check Your Work
\(\ln11/\ln4\approx1.730\). - How many orders separate \(10^8\) and \(10^3\)?
Check Your Work
Five. - Which graph often linearizes \(y=ab^x\)?
Check Your Work
A semi-log graph with a logarithmic \(y\)-axis. - Which graph often linearizes \(y=ax^p\)?
Check Your Work
A log-log graph. - Interpret 60% exceedance at 14 m³/s.
Check Your Work
Flow equals or exceeds 14 m³/s about 60% of the time. - Bacterial counts range from \(2\times10^2\) to \(2\times10^7\) cells/mL. How many orders of magnitude separate them?
Check Your Work
Five. - A flow-duration curve gives 9 m³/s at 95% exceedance. What does this indicate?
Check Your Work
Flow is at least 9 m³/s approximately 95% of the time. - If \(C(t)=6e^{-0.25t}\), state the slope and intercept of a plot of \(\ln C\) versus \(t\).
Check Your Work
Slope \(-0.25\) and intercept \(\ln6\).